
A WALK AROUND TOWN
Downtown Manchester Walking Tour
A 4K walk through downtown Manchester. A film shared by Fragile Rovers.
Watch on YouTube ↗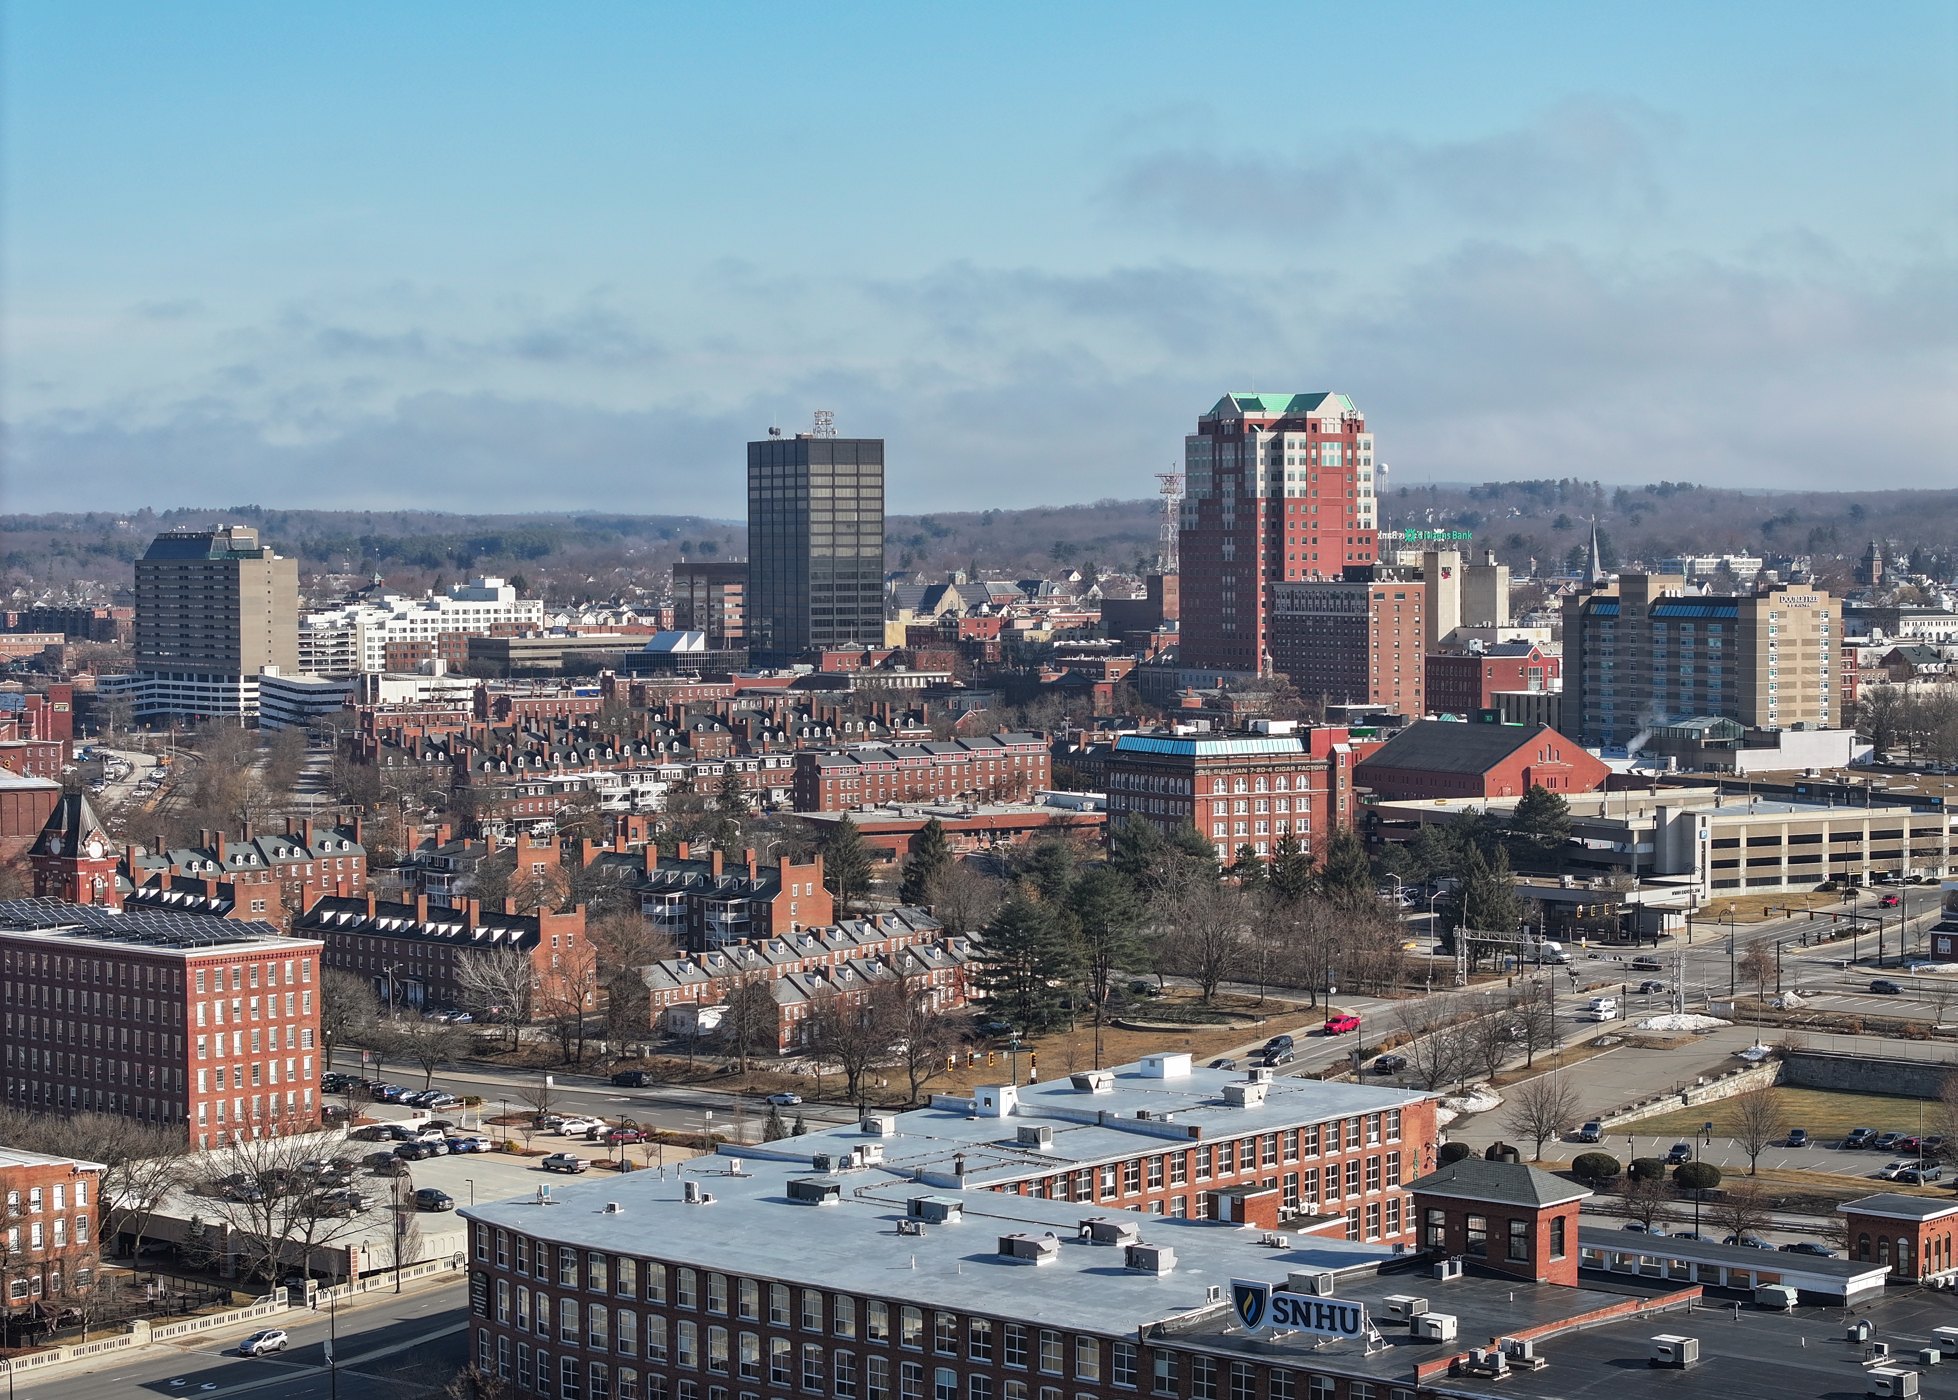
Living here
What renters actually pay, by number of bedrooms, and how Manchester compares with New Hampshire and the US.
Median rent
$1,465/mo
9% above US
1 bedroom
$1,150/mo
3% below US
2 bedrooms
$1,593/mo
19% above US
Renters paying 30%+ of income
51%
US 50%
Renter households
25,135
Median gross rent (contract rent plus utilities) for occupied rental units, by bedrooms. Income needed uses the 30% rule.
At 30% of income you can spend about $1,593 a month.
Green means the median Manchester rent for that size fits your budget. Landlords often ask for income of 2.5–3× the monthly rent.
51% of Manchester renters spend 30% or more of their income on rent, and 22% spend half or more. The typical renter household puts 30.5% of its income toward rent (US: 50% and 25%).
Median gross rent for each ZIP Code Tabulation Area that overlaps Manchester.
HUD’s 2027 fair market rents for Manchester, NH HUD Metro FMR Area are the payment benchmarks for housing vouchers (about the 40th percentile of recent movers’ rents), so they often differ from the medians above.
A WALK AROUND TOWN
A 4K walk through downtown Manchester. A film shared by Fragile Rovers.
Watch on YouTube ↗
A DRIVE AROUND TOWN
Manchester - New Hampshire - 4K Downtown Drive. A film shared by Mileage Mike Travels.
Watch on YouTube ↗The median gross rent (rent plus utilities) is $1,465 a month, 3% above the New Hampshire median and 9% above the national median.
The median one-bedroom rents for $1,150 a month (US: $1,180).
The median two-bedroom rents for $1,593 a month (US: $1,338).
Using the common 30% rule, a median two-bedroom ($1,593) takes a household income of about $63,720 a year, and a one-bedroom about $46,000.
About 51% of Manchester renters spend 30% or more of their income on rent, and 22% spend at least half (US: 50% and 25%).
Source: U.S. Census Bureau, American Community Survey 2019–2023 5-year estimates (tables B25031, B25070 and B25071). Estimates have margins of error; figures are in 2023 dollars.